How Renewable Energy is Reshaping the Energy Markets

It is in this context that the world has increasingly been turning to renewable energy - solar photovoltaic, concentrating solar power, onshore and offshore wind, hydropower, geothermal, bioenergy and ocean tide & wave as choice sources of energy in recent years. 36.9% of renewables are used for electricity and heat production worldwide, while 43.1% are used in the residential, commercial and public sectors (Renewables Information 2018, by the International Energy Agency (IEA)).
Huge Potential Waiting to be Tapped
Geothermal power refers to the electricity generated from the heat from geothermal sources – water heated by hot underground rocks to drive a steam turbine. Wind electricity is produced when wind-driven turbines generate electricity. Oceanic wave and tidal energy refers to electricity produced from devices driven by the huge amounts of energy contained in motion of waves and tides. Hydropower supplies the vast majority of renewable electricity, generating 16.3% of world electricity, and 68.4% of total renewable electricity.
Renewables grew by over 4% in 2018 and contributed about a quarter of the growth in primary energy demand in 2018, and accounted for 45% of electricity generation growth. The share of renewable energy in the world’s energy mix is increasing vigorously with the International Energy Agency (IEA) in its report, Renewables 2018, projecting that renewables will grow by 20% and will help meet 12.4% of global energy demand, and provide almost 30% of electricity supply by 2023, increasing from 24% in 2017.
Renewables contribution to heat energy supply will attain 12% in 2023, an increase of 20% since 2017. With current trends, renewables are expected to account for about 18% of global energy supply by 2040. (Source: Global Energy & CO2 Status Report. The latest trends in energy and emissions in 2018).
And the Factors Playing in Renewables Favor…
On the other hand, the cost of competing (conventional non-renewable technologies) energy sources is increasing. Though the earth’s crust still holds enormous quantities of oil, coal, and natural gas resources, the ongoing depletion of these resources means that cheap, good quality fossil fuels are becoming rarer as the highest-quality, easiest-to-access resources are typically targeted first. During the decade from 2005 to 2015, the oil industry’s costs of production rose by over 10 percent per year. While new extraction technologies make lower-quality resources accessible (like oil from fracking), these technologies require higher levels of investment and usually entail heightened environmental risks.
But there are Some Downsides …
Just like other power plants, renewables also require high investment - the high initial cost of installation and expensive storage systems are major hurdles in the development of renewable energy. Selecting an appropriate site for renewables can be challenging. Sunlight, wind, hydropower, and biomass are more readily available in some places than others. Long-distance transmission entails significant investment costs and energy losses. Moreover, transporting biomass energy resources reduces the overall energy profitability of their use. The small scale of many renewable projects cre¬ates problems in obtaining private financing as many larger financial institutions will be unwilling to consider small projects.
Financial institutions have tended to view financing of energy projects, more so private sector projects, as significantly riskier compared to other types of business projects. Perceived risks including construction, political, project costs uncertainties and high cost of feasibility studies, exchange risk, security risk, and market and country risk. Energy subsidies prevalent in oil and gas exporting countries but also present in importing countries make renewables comparatively more expensive.
However, With Some Ingenuity, These Challenges Are Surmountable
Different Regions, Different Tales
There are also huge disparities in the contribution and mix of renewables between regions. The world’s major emerging economies – including China, India, and others – are betting heavily on wind, solar and other renewables. In the EU, renewable energy targets and country level policies are helping spur renewables.
Renewable energy by type, major countries in 2016, 1990 and 2016, and share in total electricity generation, 2016
Hydro 1990 2016 % 2016
China 126,720 1,193,374 19%
Canada 296,848 387,208 58%
Brazil 206,708 380,911 66%
-------------------------------------------------------------------------------------
Wind 1990 2016 % 2016
China 0 237,071 4%
United States 3,066 229,471 5%
Germany 2151991 78,598 12%
-------------------------------------------------------------------------------------
Solar 1990 2016 % 2016
China 0 61,586 1%
Japan 67 50,952 5%
United States 666 50,334 1%
-------------------------------------------------------------------------------------
Total renewables 1990 2016 % 2016
China 126,720 1,531,408 25%
United States 346,434 651,937 15%
Brazil 210,246 470,722 81%
-------------------------------------------------------------------------------------
Of the major energy consumers, Brazil has one of the highest uses of renewable energy with almost 45% of total energy coming from renewables, mainly bioenergy in transport and industry and hydro generated electricity.
China, on account of its deliberate measures to reduce harmful air pollution is leading in terms of absolute growth and is surpassing the European Union to become the largest consumer of renewable energy. China has been particularly active in deploying solar PV contributing 75% of global development of solar PV systems in the five years to 2017 according to Brent Wanner, IEA Energy Analyst. By committing to these new clean technologies, countries like China are helping drive down costs, benefitting the world. IEA forecasts that by 2021, more than one-third of global cumulative solar PV and onshore wind capacity will be located in China.
Focusing on the Most Promising Energy Niche - Electricity

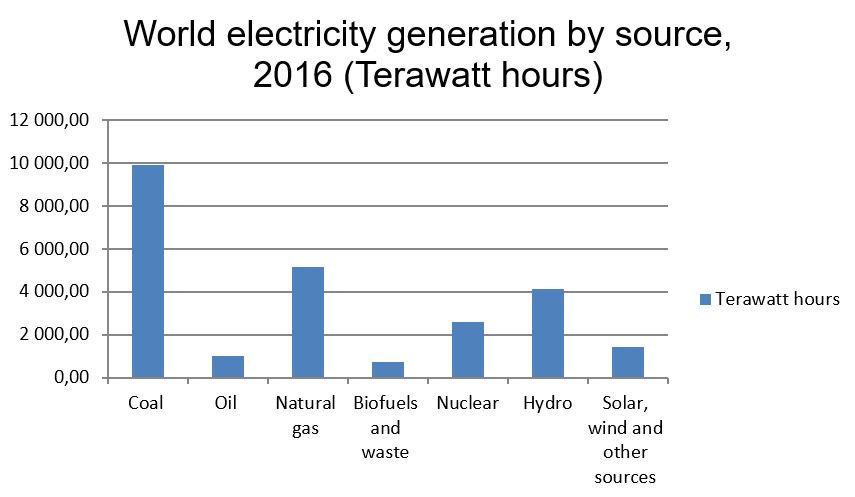
Although growing rapidly, renewables are the second largest contributor to global electricity production accounting for 23.8% of world generation in 2016, after coal (39.2%) and ahead of gas (23.6%), nuclear (10.6%) and oil (3.8%). According to IEA, hydropower is currently the largest renewable source, and will be meeting 16% of global electricity demand by 2023, followed by wind (6%), solar PV (4%), and bioenergy (3%). Biofuels and waste play a minor role in electricity generation. Since 1990, renewable electricity generation worldwide grew on average by 3.7% per annum, which is slightly faster than the total electricity generation average growth rate of 3%. So, whilst 19.4% of global electricity in 1990 was produced from renewable sources, this share increased to 23.8% by 2016. In particular Solar PV and wind have experienced exponential growth in recent years.
World electricity generation by source, 1990, 2000, 2010 and 2016
|
1990 |
2000 |
2010 |
2016 |
Percentage |
Average |
||
|
Source |
share |
Annual increase |
|||||
|
Thermal |
7,696.70 |
10,110.70 |
14,747.80 |
16,796.50 |
67% |
3% |
|
|
- Coal |
4,597.50 |
6,039.60 |
9,009.20 |
9,914.20 |
40% |
3% |
|
|
- Oil |
1,333.80 |
1,324.90 |
1,036.60 |
986.2 |
4% |
-1% |
|
|
- Natural gas |
1,652.00 |
2,539.50 |
4,245.10 |
5,169.80 |
21% |
4.5% |
|
|
- Biofuels and waste |
113.3 |
206.6 |
457 |
726.3 |
3% |
8% |
|
|
Nuclear |
2,019.80 |
2,589.00 |
2,756.30 |
2,608.10 |
10% |
1% |
|
|
Hydro |
2,192.10 |
2,706.60 |
3,528.40 |
4,152.20 |
17% |
2.5% |
|
|
Solar, wind and other sources |
61.6 |
103.9 |
513.8 |
1,431.30 |
6% |
13% |
|
|
Total |
11,970.10 |
15,510.20 |
21,546.30 |
24,988.20 |
100% |
3% |
|
Source: Energy Statistics Yearbook 2019, Department of Economic and Social Affairs, United Nations
Angling for More Accessible and Affordable Energy
Can Renewables Rev Up Transport Through Bioenergy and Electricity?
However, as renewables increases their role in electricity, renewable electricity consumption in road (electric cars and buses) and rail transport is projected to increase by 65% over the period 2018 to 2023, though from a low base. Electric mobility is expanding at a rapid pace. In 2018, the global electric car fleet exceeded 5.1 million, up 2 million from the previous year and almost doubling the number of new electric car sales. Electric vehicles on the road in 2018 consumed about 58 terawatt-hours (TWh) of electricity, largely attributable to two/wheelers in China. (Source: Global EV Outlook 2019: Scaling up the transition to electric mobility).
As a result of its considerable use in heat and transport, bioenergy – as solid, liquid or gaseous fuels - has an essential role to play, more so in the transport sector where it helps to decarbonize long-haul transport (aviation, marine and long-haul road freight).
Powering Economies, Reducing Poverty and Transforming Livelihoods
In agriculture, the major economic sector in most of the developing world, application of energy allows deployment throughout the entire production and marketing chain, of modern technology and equipment which fundamentally improves production, enhances productivity and reduces product spoilage and loss. Improved food production and incomes in turn has ripple positive effects including improved food security, nutrition, and health. Energy also improves access to water by powering water supply systems.

Towards a Greener Energy Sector
Society still derives most of its energy from fossil fuels. Every year the amount of carbon dioxide in the atmosphere is increasing by 10.65 billion tons, which is conceived to be the leading contributor to global warming. In 2017, the Energy Sector Carbon Intensity Index increased for the first time in three years as fossil fuels met over 70% of the growth in energy demand according to IEA. While energy intensity – primary energy demand per unit of gross domestic product – has improved over time, this improvement slowed to 1.7% in 2017, compared with an average of 2.3% over the previous three years, and only half the annual improvement rate that would be consistent with delivering the Paris Agreement goals.
In IEA’s estimation, nuclear fission power is not likely to play a larger role in energy future than it does today, outside of China and a few other nations, if current trends continue. High investment and safety requirements, growing challenges of waste storage and disposal, and the risks of accidents may cause significant overall shrinkage of the nuclear industry by the end of the century.
That leaves renewables to shoulder the burden of powering future society and keep a lid on environmental pollution. While significant progress has been made in deploying renewables, in particular solar PV and wind, this has not kept up with energy demand growth. Renewables growing prominence is in electricity generation, but electricity accounts for only a fifth of global energy consumption. The role of renewables in the transportation and heating sectors therefore will remain critical to the energy transition.
According to Adam Brown, Senior Energy Analyst at IEA, modern bioenergy in final global energy consumption should increase four-fold by 2060 in the IEA's 2°C scenario. Bioenergy is expected to deliver on nearly 20% of the additional carbon savings needed to meet announced global environmental policies.
For Investors: Opportunities, Optimism, and Some Diligence
In 2017 renewables accounted for a record two-thirds of electricity generation investment supported by a more than 25% expansion in solar PV installations and record growth in offshore wind. As costs continue to fall, energy storage installations have tripled in less than three years, largely driven by lithium ion batteries. Small-scale battery storage is also making inroads, and in off-grid solar applications for energy access, the vast majority of systems now include a storage unit.
Corporate investments in new energy technology companies are growing strongly, reaching their highest ever level of just over USD 6 billion in 2017. The aim is to develop and promote renewable energy technologies and products such as biofuels and biogases to replace oil and other fossil fuels in heating and transport, and provide ICT solutions to the sector (IEA: World Energy Investment 2018- Investing in our energy future)
For private sector financial intermediaries, opportunities exist in devising and deploying suitable financing instruments given the unique features and geo-political risks of renewable energy projects. That way, they can aim to play a bigger role since in many countries, the public sector; international donors and multilateral development banks have taken the lead role in renewable energy investments.
Looking to the Future
- How far the prices of per unit costs of renewables fall, riding on technology improvements and development of new and cost-effective technologies;
- The relative future competitiveness of fossil fuel prices over time as well as the rate of ongoing trend toward switching away from fossil fuels as seen in the number of existing non-renewable power plants retired and the pace of construction of new non-renewable energy power plants.
- Trends in future energy and electricity demand. The rate of adoption of biofuels in transport and heating as well as the flexibility of industries and other consumers in terms of being able to take advantage of low-cost electricity that would be made available during times of peak renewable energy production and hence ensure fuller use of installed capacities and reduce system costs associated with capacity redundancy, energy storage, and multiple long-distance grid interconnections.
- Investment in additional transmission capacity and the extent of adoption of measures to aggregate the output of dispersed renewables facilities and integrate into the power system;
- The level of private sector involvement and the availability of appropriate funding from private and public sources to raise equity and loans for projects;
- Government incentives and subsidies and standards set by regulators including future carbon prices or subsidies for green energy.
Deliberate Interventions to Define the Clean Energy Future
Related reading
06 November 2017
17 May 2019
21 September 2018


